

Trump’s Flip-Flop Canada Tariff Chaos: S&P 500 Down 9.3%—Time to Sell Your Stocks?
Summary
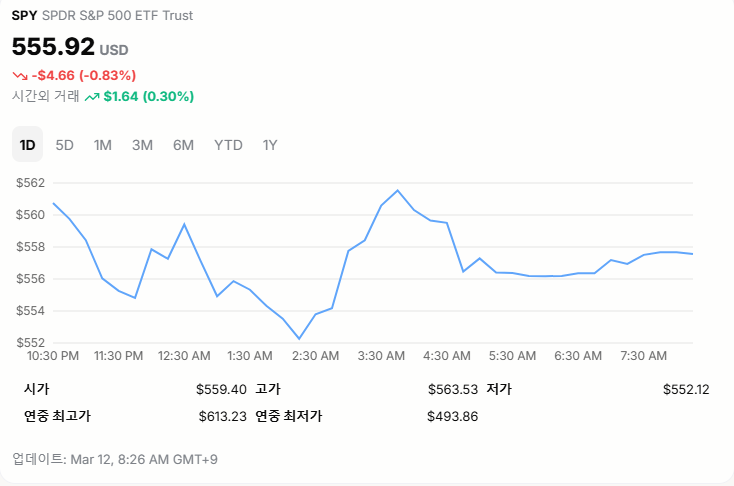
Trump’s erratic Canada tariff moves rattle markets! S&P 500 drops 0.76% to 5,572.07 on March 11, 9.3% off its peak—nearing correction. Jobs beat at 7.74M, but all eyes are on March 12 CPI!
Detailed Explanation
Trump’s back-and-forth on Canada tariffs has markets in a spin! On March 11 (U.S. time), the Dow fell 1.14% to 41,433.48, S&P 500 slid 0.76% to 5,572.07, and Nasdaq dipped 0.18% to 17,436.10. Ontario’s 25% electricity surcharge sparked Trump’s “50% steel/aluminum tariff” threat, triggering a midday plunge. Late relief came as Ontario backtracked and the White House scrapped the 50% plan, though 25% tariffs linger. S&P 500’s 9.3% drop from its 6,144.15 high puts it a hair from correction territory (10%+). January jobs hit 7.74M, but March 12 CPI looms large—should you sell now? Let’s break it down for subscribers!
Table of Contents
- Trump’s Canada Tariff Chaos Sparks Market Turmoil
- S&P 500 Nears Correction: Market Data Breakdown
- Jobs Beat Expectations, CPI Awaited
- Key Term Explanations
- Top Stock Movers
- Company Performance Insights
- Pros & Cons: Navigating Tariff Chaos
- Subscriber Questions
- Recommended Investment Products
Trump’s Canada Tariff Chaos Sparks Market Turmoil
Ad Space
Trump’s latest tariff flip-flop has investors on edge! Ontario’s 25% power surcharge prompted a fiery “50% tariff” post on Truth Social, tanking stocks early. After Ontario folded and Trump softened, markets trimmed losses—but his “markets go up and down” quip didn’t help. White House later nixed the 50% hike, yet 25% tariffs remain. How long will this rollercoaster last?
S&P 500 Nears Correction: Market Data Breakdown
- Dow: -478.23p (1.14%), 41,433.48.
- S&P 500: -42.49p (0.76%), 5,572.07 (9.3% off peak 6,144.15).
- Nasdaq: -32.22p (0.18%), 17,436.10.
S&P 500 hit a 1.5% intraday drop (5,528.41), briefly crossing the 10% correction line before recovering. It’s now teetering at 9.3% below its February 19 high—Nasdaq’s already in correction. Volatility’s spiking; how’s your portfolio holding up, subscribers?
Jobs Beat Expectations, CPI Awaited
January JOLTS data showed 7.74M job openings, topping 7.51M last month and 7.60M expected—a labor market bright spot. Still, focus is on March 12’s February CPI. Inflation fears could derail rate-cut hopes, while Ukraine’s 30-day truce nod offers some relief. CPI’s the next big domino—brace yourselves!
Key Term Explanations
- Correction: Index drops 10%+ from its peak.
- CPI: Consumer Price Index, tracks inflation.
- JOLTS: Job Openings and Labor Turnover Survey, gauges hiring health.
- Tariff: Tax on imports, hiking costs.
Top Stock Movers
- Tesla: +3.79%, ~$207 (post -15% bounce).
- Nvidia: +1.66%, ~$122.
- Delta Air Lines: -7.25%, demand outlook cut.
- Southwest Airlines: +8.34%, baggage fee boost.
Company Performance Insights
- Tesla: 2024 revenue ~$967B projected; Trump’s “I’ll buy Teslas” lifts spirits.
- Delta Air Lines: 2025 demand dip forecast sinks shares.
- Kohl’s: Weak consumer spending slashes outlook, -24.06%.
Pros & Cons: Navigating Tariff Chaos
- Pros: “Tariff clarity could spark a rebound—Tesla’s a buy on dips!”
- Cons: “CPI surprise could tank markets further—safe havens now!”
Subscriber Questions
- Will S&P 500 keep falling if it hits correction?
- Tesla’s rebounding—safe to buy now?
- How should I prep for March 12 CPI?
- When will tariff chaos end?
- Is it time to shift to safe assets?
Will S&P 500 Keep Falling if It Hits Correction?
S&P 500’s at 5,572.07 (9.3% off 6,144.15), inches from correction.
- Data: 200-day MA ~5,600 (breach signals more downside); past corrections averaged -7.6% to -15%, 26 days.
- Outlook: Goldman Sachs sees a 5% dip then stabilization; Morgan Stanley warns of 5,200-5,500 if tariffs and CPI disappoint.
- Verdict: 5-10% more downside possible, but CPI and tariff news could flip it. Watch 5,500 support!
Tesla’s Rebounding—Safe to Buy Now?
Tesla’s up 3.79% to ~$207 after a -15% rout.
- Stats: Down 33% YTD from $488 peak; RSI ~35 (oversold hint).
- Upside: Trump’s support, bargain hunting.
- Risk: Tariff-driven EV slowdown.
- Call: Small buy now, add below $190—target $220 short-term, $300 long-term if EV rebounds.
How Should I Prep for March 12 CPI?
February CPI on March 12 could sway markets.
- Context: Jan CPI 3.1% (vs. 2.9% exp.), core 3.9%; 10-yr yield 4.28%.
- Scenarios: >3.2% = sell-off (S&P 5,500 test); <3.0% = rally (5,700 push).
- Prep: Trim risk pre-CPI; buy SPY if low, hedge with KODEX Gold if high.
When Will Tariff Chaos End?
Trump’s Canada tariff saga (25% intact, 50% scrapped) drags on.
- Timeline: March-end/April deal could calm things; May/June if delayed.
- Expert: Ser Sang-young (Mirae Asset) bets on H2 stability.
- Take: April’s the tipping point—mind March 21 expiry volatility!
Is It Time to Shift to Safe Assets?
Uncertainty’s pushing safe-haven demand.
- Signals: Gold $2,912 (+1.5%), 10-yr yield 4.28%, dollar index 103.42 (-0.41%).
- Pros: CPI risk looms—Kim Ji-young (Kyobo) says “go defensive.”
- Cons: H2 rebound hope—Lee Jin-woo (Meritz) suggests holding some growth.
- Move: 60% safe (gold, bonds), 40% stocks—perfect timing now!
Wrap-Up
S&P 500’s on the correction brink, Tesla’s bouncing, but CPI and tariffs hold the keys. Hedge with safe assets and play the dips—your next move, subscribers?
Recommended Investment Products

#Tags
#TrumpTariffs #S&P500Drop #TeslaRebound #CPIPrep #SafeAssets
'BizMONEY' 카테고리의 다른 글
| Trump Tariff Chaos vs. Cooling CPI: S&P 500 Up, Dow Dips—What’s Next for Stocks? (0) | 2025.03.13 |
|---|---|
| 트럼프 관세 혼란 vs. 둔화되는 CPI: S&P 500 상승, 다우 하락- 주식 시장의 향후 전망은? (2) | 2025.03.13 |
| 트럼프 ‘오락가락’ 대캐나다 관세 혼란: S&P500 9.3%↓, 지금 주식 팔아야 할까? (1) | 2025.03.12 |
| Trump’s Recession Fears Slam KOSPI: Buy or Sell Your Stocks Now? (0) | 2025.03.11 |
| 트럼프의 경기 침체 공포가 코스피를 강타: 지금 주식을 살까, 팔까? (0) | 2025.03.11 |